How we made a 9 MB WebAssembly module feel faster without removing a single byte
Recraft Studio is a web app where you generate images and then work with them on a canvas. The canvas lives on one very important page — the editor. It is a huge page with a lot of tools, and one day we faced a problem: how long our editor is loading.
Four pull requests later, the editor reaches the first render on the canvas 15–19% faster, at p50, p75 and p90 alike.
That took about 300 lines of code!
The part I find interesting is what those lines did not do: the page still downloads exactly the same bytes as before — 16.75 MB then, 16.71 MB now.
Nothing was removed and nothing was compressed. The only thing that changed is when the largest file starts loading. That largest file is our rendering engine: our own fork of Skia, compiled to WebAssembly, 9.2 MB over the wire.
This number does not come from a before/after chart.
The change ran as a real experiment with a control group — about 18k users in each arm, over the same five days.
The funnel said 8.5 seconds at p75
It began with a fairly obvious task: I was going to make some improvements around our custom performance marks. I made the changes, added a couple of extra logs, and then I got curious about the numbers.
I opened Amplitude, put together a few charts, and I was surprised. It was not a pleasant surprise — about 8.5 seconds at p75 for the moment when the user sees the fully rendered scene on the canvas. Nobody had complained, there was no incident. The instrumentation itself was the discovery.
Here is what I measure:
- loading-state-shown — time to show the loader
- websocket-connected — time to establish a connection to our realtime storage
- room-data-synced — time to get the project data
- skia-loaded — time to the WASM module being downloaded
- engine-initialized — a callback that fires once everything is there: the JS chunks, the WASM module, all of it, and the engine is available in React
- canvas-rendered — time to the first scene rendered on the canvas
- images-loaded — time to all image data in the project being loaded
One thing to keep in mind when reading the numbers: canvas-rendered and engine-initialized sometimes land in what looks like the wrong order. The first scene is rendered outside React, while engine-initialized is reported from a useEffect — so it fires when React gets around to it, not when the engine is actually ready.
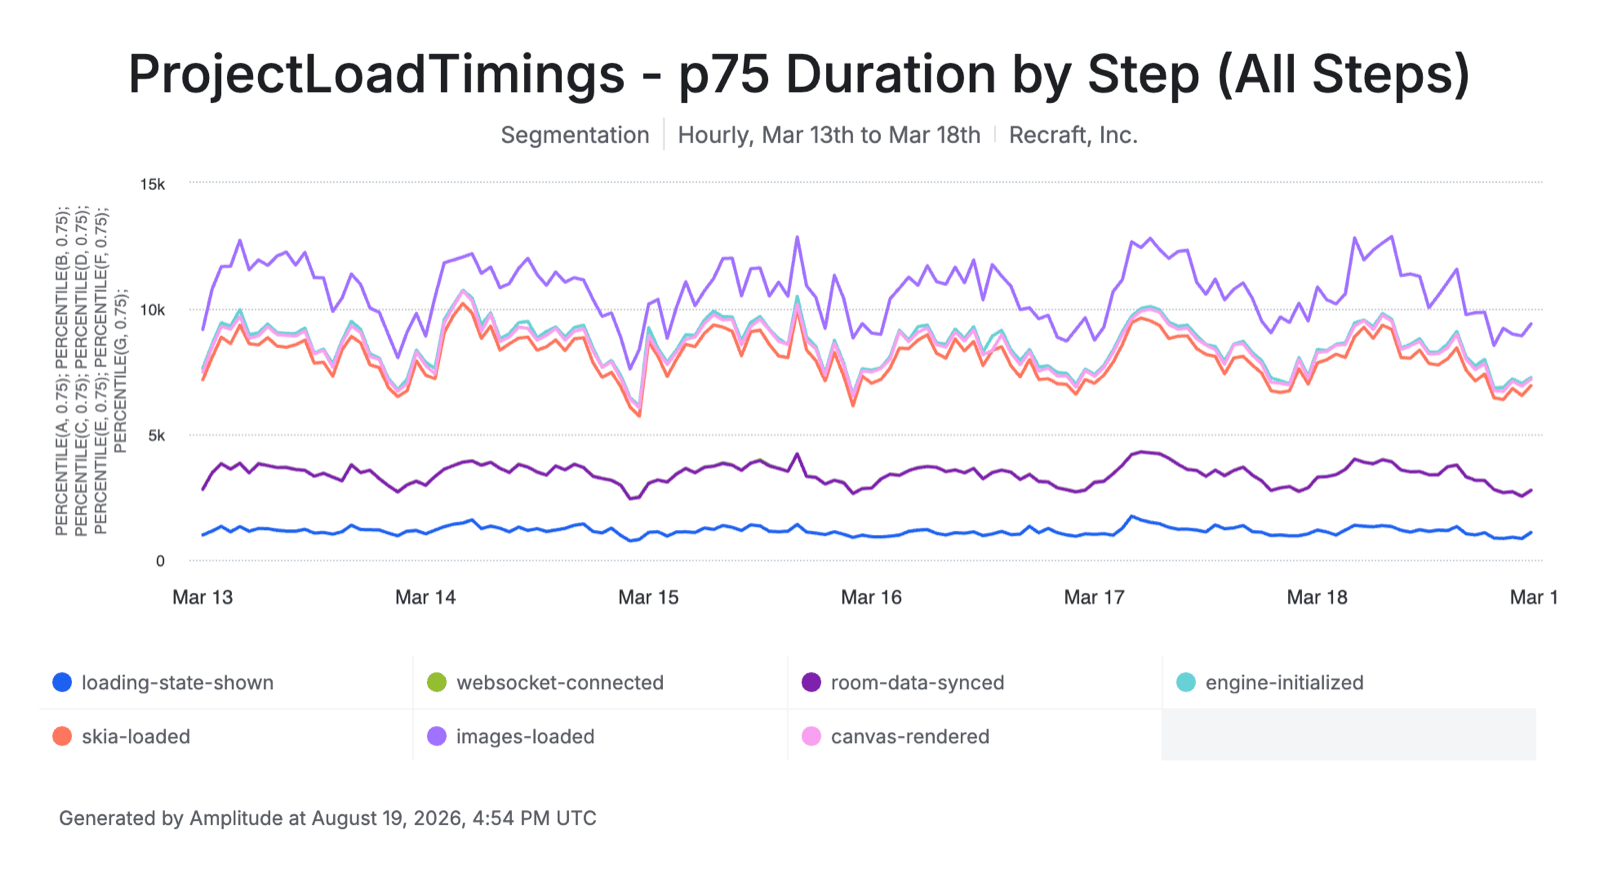
It was a disaster.
The biggest file was requested last
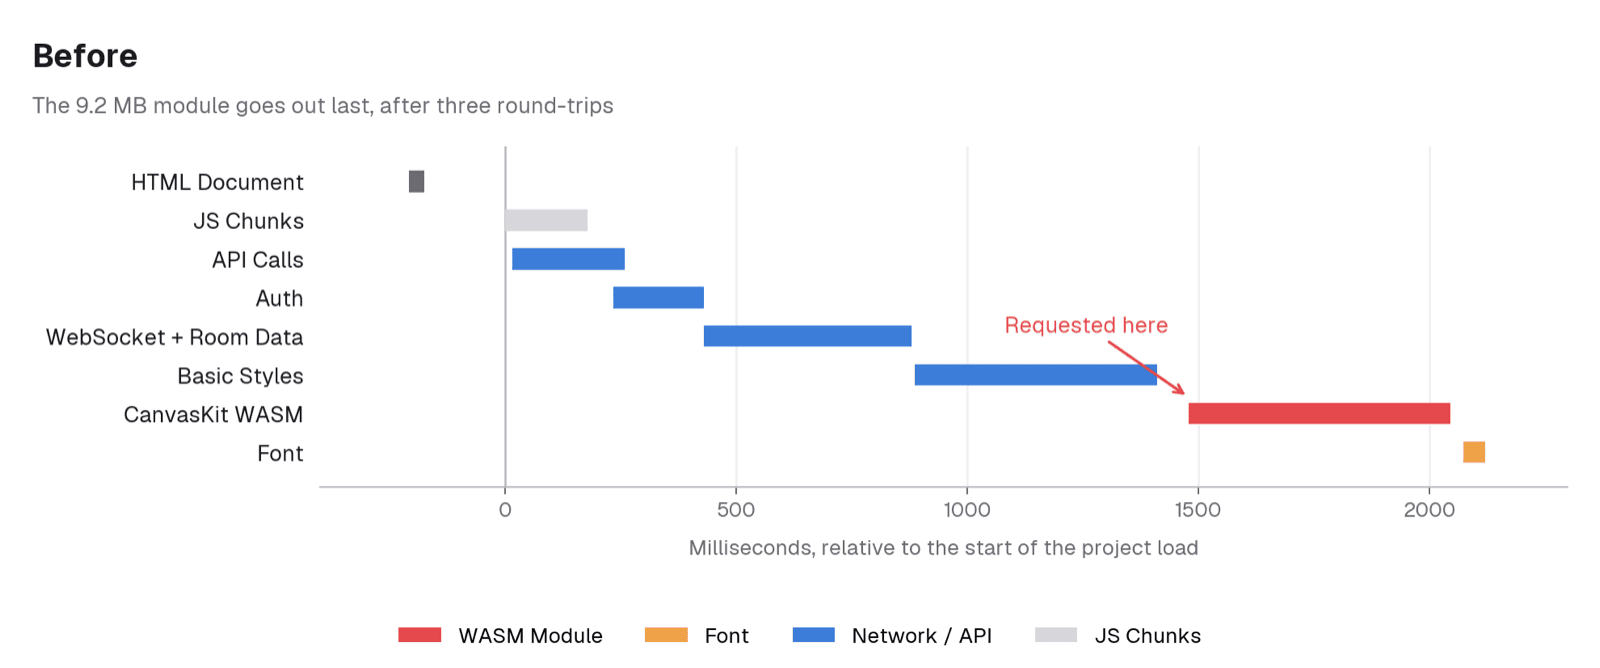
Let me explain how the editor used to load.
First the HTML, of course, and a bunch of JS chunks. Once those are parsed, we authorize and connect to the realtime storage, and wait for the project data to arrive. Then we request the data the editor needs to work — the basic styles. And finally, we send the request for the WASM module.
The last one is the biggest one. Such a shame.
Why did we end up in this position? It is simple: the import of the WASM module lives in a lazy chunk. That means the browser had no way to know that file exists until it had parsed a lot of JS and waited for the styles to come back.
To be fair, it looked terrible:
You probably want to ask me a couple of questions about the size of that module:
- 9.2 MB is too expensive to compile.
- 9.2 MB is just too big.
The first one is not a problem. The browser starts compiling the file as soon as it gets the first byte — compilation streams, in parallel with the download, and instantiating from cache afterwards is close to free. This is not a CPU problem, it is a network problem.
The second one is a real issue, and I will tell you how we solved it in the next article.
9 MB discovered last, behind three round-trips and a React tree
The WASM module is the largest thing this page downloads, and its URL is known before a single line of our JS runs. It could go out with the HTML. Instead it goes out after three network round-trips and a walk down the React tree. Let me show you why.
export const EngineProvider: FC<PropsWithChildren<Props>> = ({...}) => {
  ...
  if (room.getStorageSnapshot() === null) {
    room.connect()
    throw room.getStorage()
  }
  ...
}
This is the first part of the problem. We connect to the realtime storage and suspend until the project data arrives. Everything below this component simply does not exist for the browser yet.
Dig deeper and there is one more strange thing:
const Content: FC<Props> = ({ viewOnly = false }) => {
  ...
  useConnectionDetect()
  useLoadBasicStyleSuspense()
  useGetCurrentUserStatistics()
  ...
}
Same shape: we stop walking the React tree and wait until the data has loaded. In the trace you can see it clearly — the request for the basic styles goes out eight milliseconds after the room data lands. It was not waiting for the network. It was waiting for its turn in the tree.
And below it is this:
export const Stage = ({ children, ...props }: Props) => {
  useKitInit()
  useFontInit()
  useInitSkiaWorker()

  useProjectLoadTracker()(ProjectLoadStep.SkiaLoaded)

  return <StageComponent {...props}>{children}</StageComponent>
}
Two hooks in a row. The first one suspends, so the second one never gets to run — we literally wait for a 9.2 MB WASM module to finish downloading before we start requesting the font.
Now you can see the full picture:
- Parsing the initial JS chunks
- Waiting for the live project storage connection
- Waiting for the basic styles
- Downloading and initializing CanvasKit
- Waiting for the fonts
- Rendering the first scene on the canvas
Six steps, and the URL was available at step zero.
A preload hint and one call at module scope
Now let me tell you how I decided to fix it.
First, preload. It was the first thing that popped into my mind. If we know the URLs of all our resources, why wouldn’t we insert preload links into the head of the page?
export const SkiaPreloadLinks = () => (
  <NextHead>
    {PRELOAD_HREFS.map(({ href, as, type, crossOrigin }) => (
      <link
        key={href}
        rel="preload"
        href={href}
        as={as}
        type={type}
        crossOrigin={crossOrigin}
      />
    ))}
  </NextHead>
)
Where PRELOAD_HREFS is:
const PRELOAD_HREFS: PreloadHint[] = [
  {
    href: `${canvaskitUrl}/canvaskit.wasm`,
    as: 'fetch',
    crossOrigin: canvaskitUrl !== '' ? 'anonymous' : undefined,
  },
  {
    href: DEFAULT_FONT_PRELOAD_URL,
    as: 'fetch',
    crossOrigin: 'anonymous',
  }
]
No walking the React tree, no waiting for other requests. The browser starts loading the critical resources immediately.
One detail here. DEFAULT_FONT_PRELOAD_URL is a hardcoded string, and it looks ugly. But importing FontCache to get that URL properly would have pulled a 652 KB fonts.json into the project page bundle — a preload that eats its own gains.
The next thing I did was to hoist the call that initializes Skia up to module level:
import { getInitialPresence, getInitialStorage } from '@utils/engine'
import { useProjectLoadTracker } from './hooks/useProjectLoadTracker'

initSkia()

type Props = {
  viewOnly?: boolean
}
initSkia() fires both initKit() and initFont(), side by side, without awaiting either. Remember the two hooks in Stage from before, where the first one suspended and the second one never got to run? Now nothing waits for anything.
This also meant FontCache.initFont() had to be rewritten from a throw-on-suspense function into an idempotent memoized promise. Otherwise the eager warming and the Suspense path would fight over the same fetch.
And the last thing: I hoisted the styles request as early as possible. Not in Suspense mode — just fire the request and handle it lower in the React tree.
const Project = () => {
  useLoadBasicStyle()

  const t = useTranslations()
  ...
}
Four lines. By the time we reach the suspending hook, the response is either already in the cache or nearly there. In a local trace that request moves from roughly 890 ms to about 15 ms — approximate numbers from my machine, not production ones.
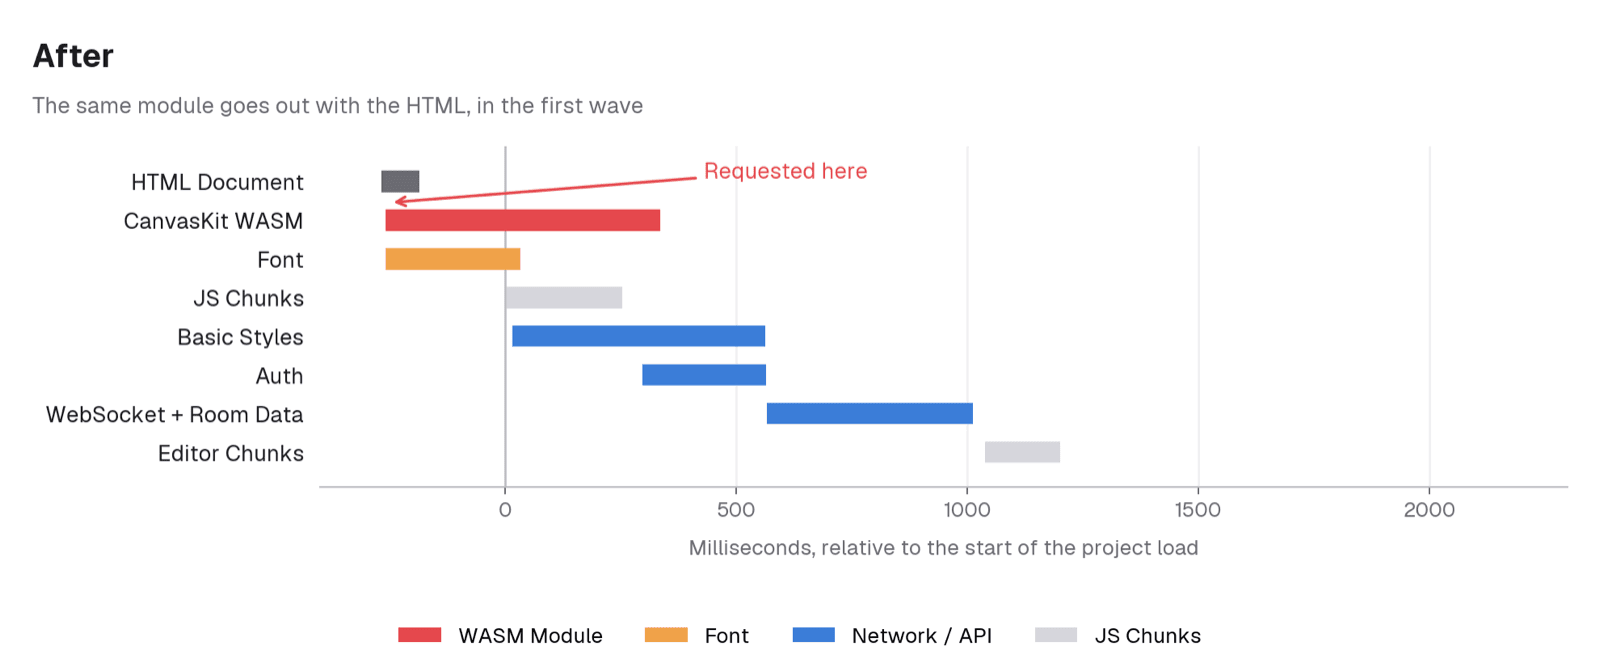
The CanvasKit request now goes out in the very first wave, together with the document — roughly 1.5 seconds earlier. And that is why the slowest users gain the most: those 1.5 seconds were bootstrap and auth, and the worse your connection, the longer that head start runs.
Where I got it wrong: preload vs prefetch
The main thing that I’d missed before is that I rolled out those changes on both pages:
/project/*— the editor page;/projects— a list of projects, it is the entry point to reach the project page.
Initially, that looked right, but not fully right, because we used the same rel for both pages. Let’s take a look at possible rel values for our purposes:
- preload — it means that resources have to be downloaded, because it is needed immediately on this page;
- prefetch — it means that resources have to be downloaded, but not now, handle it after critical resources, because it will be needed on the next page.
Unfortunately, in the first version, I used preload. It led to a resource race on the listing page. To be fair, the fix was super easy and understandable: use prefetch on the projects page, and use preload on the editor page.
const Links = ({ rel }: { rel: 'preload' | 'prefetch' }) => {
  ...
  return (
    <NextHead>
      {resourceHints.map(({ href, as, type, crossOrigin }) => (
        <link
          key={href}
          rel={rel}
          href={href}
          as={as}
          crossOrigin={crossOrigin}
          type={type}
       />
      ))}
    </NextHead>
  )
}

export const SkiaPreloadLinks = () => <Links rel="preload" />
export const SkiaPrefetchLinks = () => <Links rel="prefetch" />
Those changes pushed me to think about cache warmup for JS chunks on hovering a project card…
Three out of four hypotheses worked
Well, I guess it’s time to share the data of our improvements. I set up an experiment with 2 segments — default and on.
Let’s take a look at data:
Project load steps, default → on:
| Step | p50 | p75 | p90 |
|---|---|---|---|
| Skia Loaded | −19% | −18% | −19% |
| Engine Initialized | −17% | −16% | −15% |
| Canvas Rendered | −18% | −17% | −17% |
| Images Loaded | −16% | −16% | −18% |
What it cost — loading-state-shown:
| default | on | Δ | |
|---|---|---|---|
| p50 | 409 | 429 | +20 (+5%) |
| p75 | 1250 | 1373 | +123 (+10%) |
| p90 | 3798 | 4132 | +335 (+9%) |
As you can see in the table, we improved several key metrics. Let’s look at skia-loaded, engine-initialized and canvas-rendered, they are the most important ones for us — that is when our users can actually start working. The slowest users won the lottery: the gain goes from about 670 ms at the median to about 1900 ms at p90, so everyone gets faster, but the slowest get the most.
For example, let’s take a look at the skia-loaded metric when I turned the experiment on for all:
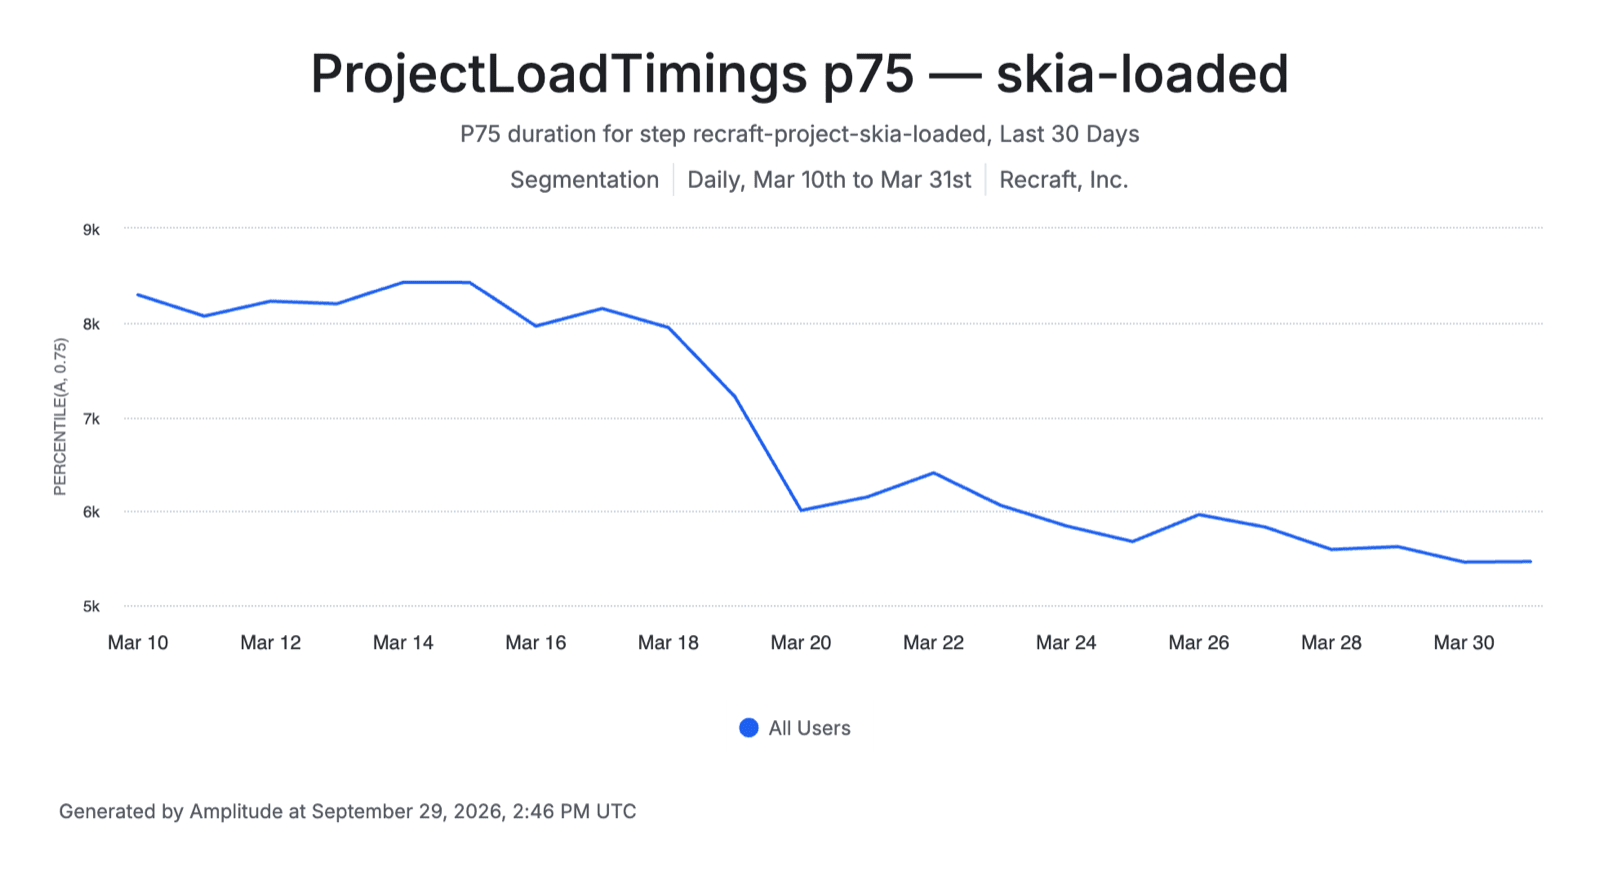
But we got a bit worse on loading-state-shown, because on page start we started loading more resources. It’s about 120ms on p75, it affected all users, regardless of their devices.
Three out of four hypotheses worked. One hypothesis didn’t work. I supposed that if I move room connection earlier, we would get better timings. Well, I was wrong. Connection wasn’t the bottleneck here. My colleague Leonid did it another way later, and it worked, but that’s a different story.
The new bottleneck: auth, handshake, room data
Well, let’s take a look precisely at what is going on now, after optimization.
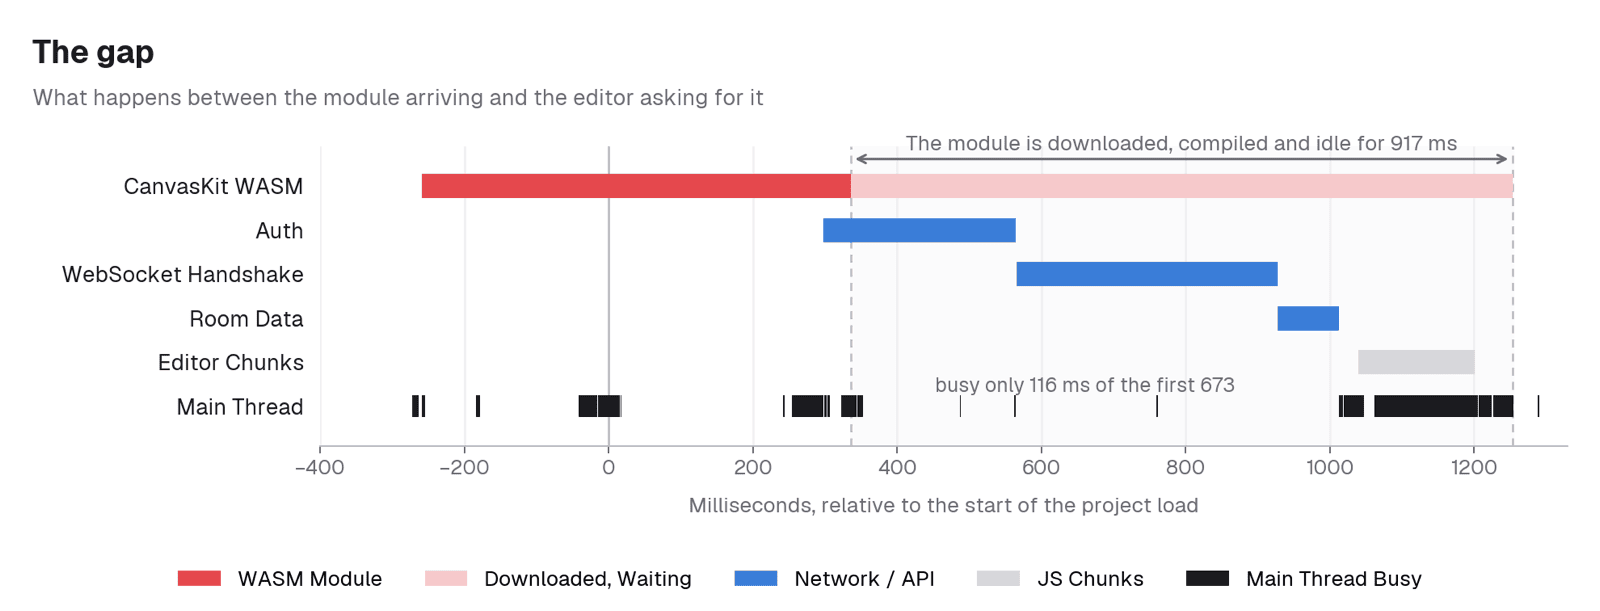
Here we are seeing that CanvasKit starts loading first, it means that CanvasKit is loaded and just sits there, waiting for the editor code to come and use it.
While our WASM module is waiting for its time to shine, we are doing a bunch of stuff: Auth → Websocket connect → Handshake → Getting room data.
Also here we can see that critical data to render also starts loading much earlier than before. Now — that request doesn’t wait for the WASM chunk!
Most of that waiting isn’t CPU work at all — the main thread is mostly idle.
The heaviest resource on the page is no longer in the critical path at all.
As a result, we got a situation where the bottleneck was moved, and now it is the network.
Hover prefetch: 631 → 193 ms on the loader
Yolo! Let’s get back to the cache warmup I mentioned earlier.
Since we got some degradation in the loading-state-shown metric, I decided to pay it back.
First, code splitting. Some of the components we render in the editor can’t be visible on the first frame at all. We have a bunch of various kinds of sidebars — the mockup panel, for example, only shows up when a mockup layer is selected. On init the selection is empty, so that panel simply cannot be there. No reason to ship it in the first chunk.
Second, prefetching. We can prefetch the editor chunk when the user hovers a project card — by the time the cursor travels to the click, the file is already on its way. I have to notice that Next.js already does this, but not all the way. There is one nuance in their logic: it only prefetches the chunks it knows about from the route itself, and it doesn’t follow nested dynamic imports inside your module. That was exactly our problem — our editor chunk pulls in another dynamic chunk. So I did it myself, something like this:
export const usePrefetchEditorOnHover = () => {
  const called = useRef(false)

  return useCallback(() => {
    if (called.current) {
      return
    }

    called.current = true
    void import('@/components/pages/Editor')
  }, [])
}

const handlePrefetchEditor = usePrefetchEditorOnHover()

const handleEnter = useCallback(() => {
  setHover(true)
  handlePrefetchEditor()
}, [handlePrefetchEditor])

onMouseEnter={handleEnter}
The code splitting shipped to everyone, and only the prefetch went behind the flag — so the experiment measures the hover warmup, nothing else.
As a result, we’ve got huge improvements here:
loading-state-shown, default → on, ms:
| default | on | Δ | |
|---|---|---|---|
| p50 | 239 | 36 | −85% |
| p75 | 631 | 193 | −69% |
| p90 | 1680 | 708 | −58% |
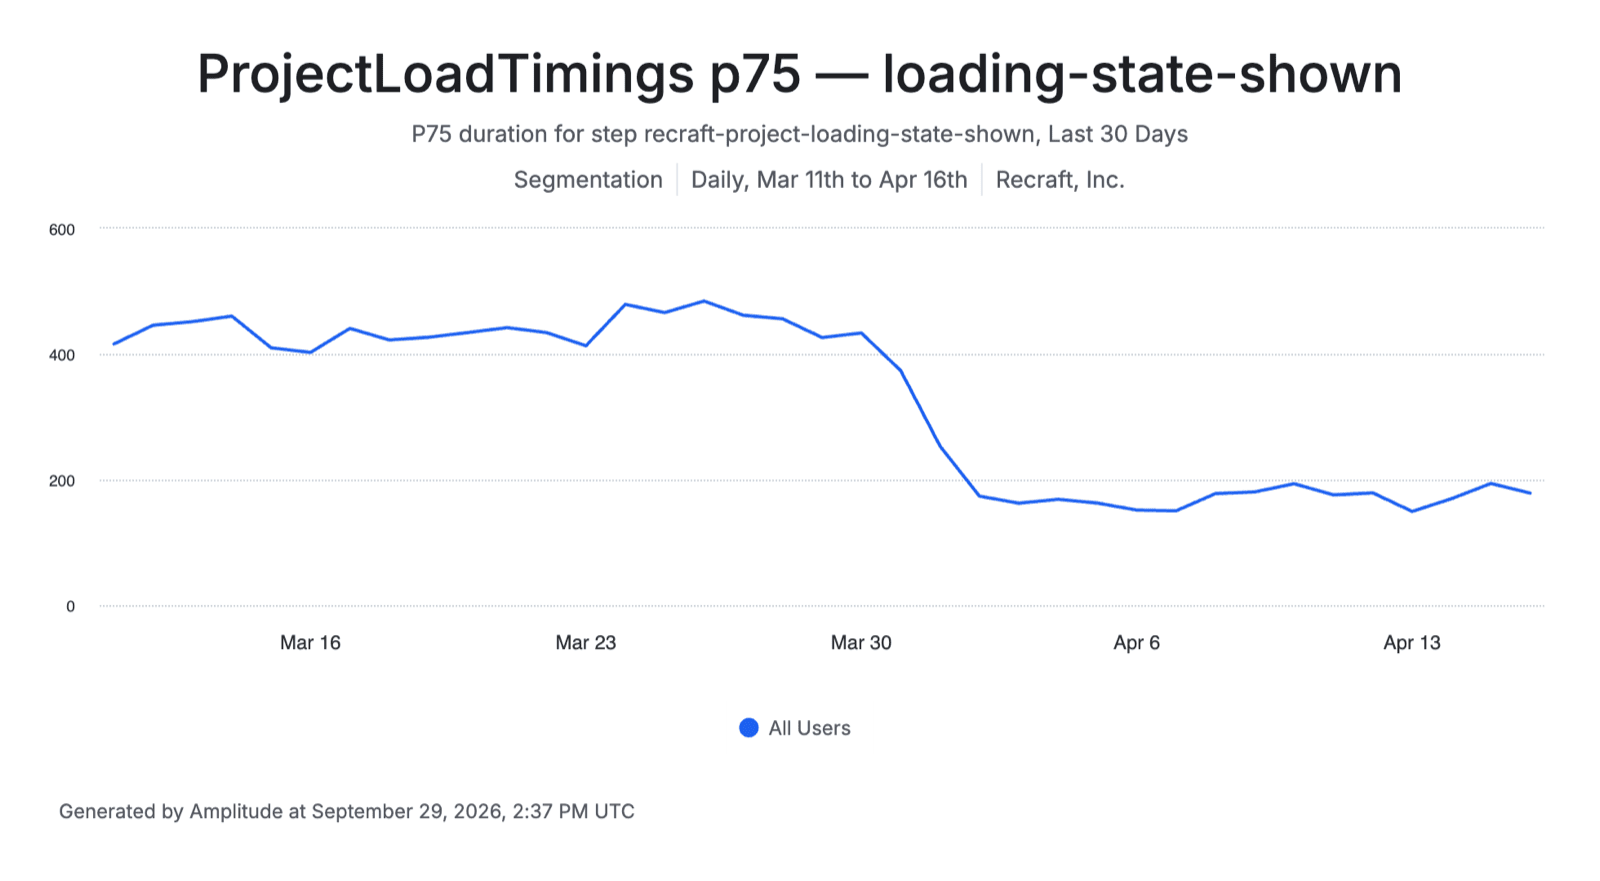
In March we sacrificed 123 ms on this metric to make the canvas faster. In April we got 438 ms back.
What I’d take away
Well, it is time to end this article. I’ve got some helpful insights here.
First, metrics really matter. If you want to understand your product — how it performs, how it actually works for your users — think about which user scenarios and pages are the important ones for your product. Then implement the marks, make them useful, and they will show you the blind spots.
It worked for us. Thanks to a task about improving metrics, I noticed we had performance issues nobody was talking about.
As a result, after a few improvements, we deliver the same amount of data — 17% faster.
Not bad for 300 lines that didn’t delete a single byte.
In our case the bottleneck didn’t disappear. We still have an issue with the amount of data, but now it affects users less than it did before.
About our WASM module size: I’ve done a bunch of improvements there too, and I’ll be really glad to share how it went in the next article.